WHY TESTMAP

Your tests passed. Your users didn’t.

Code coverage counts the lines your tests ran. TestMap shows the buttons, forms and links they never touched — ranked by how many real users hit them.
No instrumentation required • Free tier • First heatmap in 10 minutes
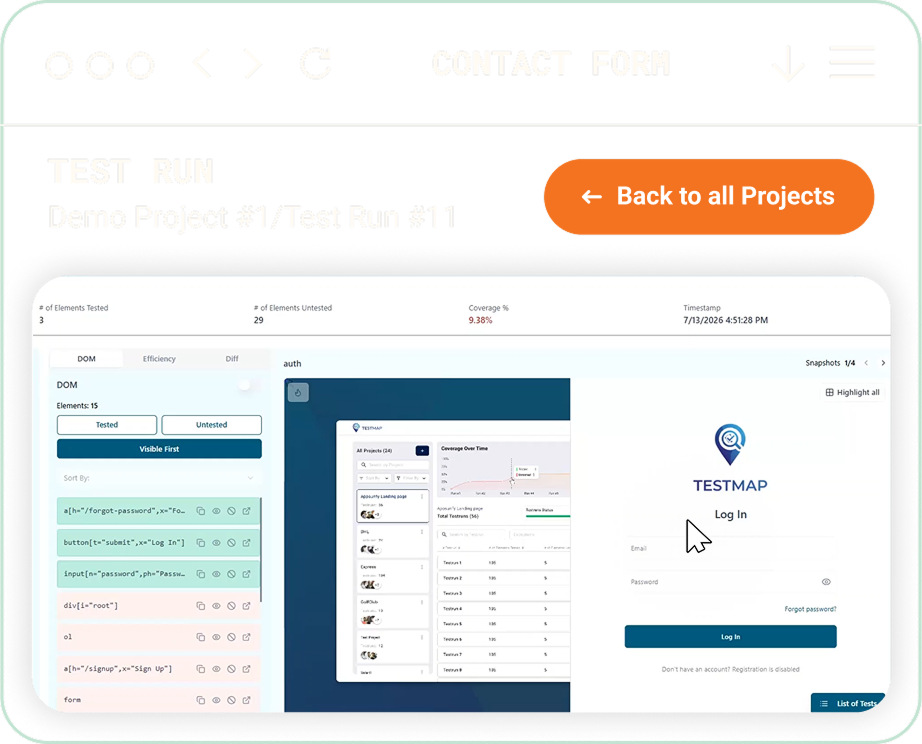
TestMap test run view of a demo contact form with two fields flagged Gap, no tests
THE PATTERN

Code coverage tells you about your code. Test coverage tells you about your product

94.2% coverage. 847 green tests. And the checkout button 89% of users hit had zero tests. The badge counted lines. Nobody counted the product. Three questions every team should be able to answer:

01
Are we covered?
The badge says 94%. Nobody trusts it.
02
What don’t we test?
No list exists.
03
Where’s the next sev-1 coming from?
The element with the most traffic and the fewest tests.
TestMap answers all three.
Composite incident; the numbers are typical.

Designed With You in Mind

Built for the people who live in tests every day.

Instant Visibility

One import, one reporter line. Every page your tests visit is mapped. Your config, projects and CI stay as they are.

Critical Gaps, Ranked

Connect Google Analytics 4 and untested elements are ordered by real traffic. Checkout at the top. The admin toggle nobody uses at the bottom.

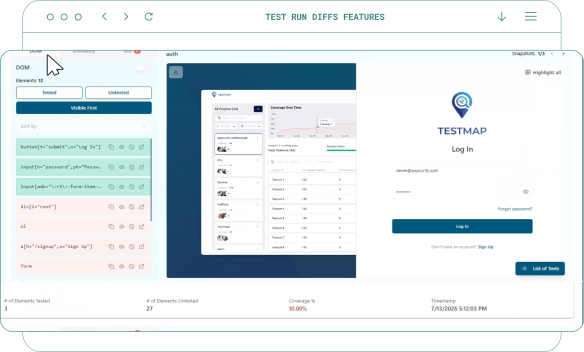
Test Run Diffs

Every run is compared with the one before. A .only left in a spec file shows up here, not in production.

Behavioral Drift, Surfaced

Coverage is re-weighted against the last seven days of traffic. A page that got popular last sprint cannot hide behind an old score.
DOM COVERAGE

See what your tests actually protect.

Every page. Every element. Painted from the tests you already run.

Open any page and see which DOM elements your Playwright or Selenium suite touches — and which it skips. Click a red element to read its selector: the test that needs to exist.
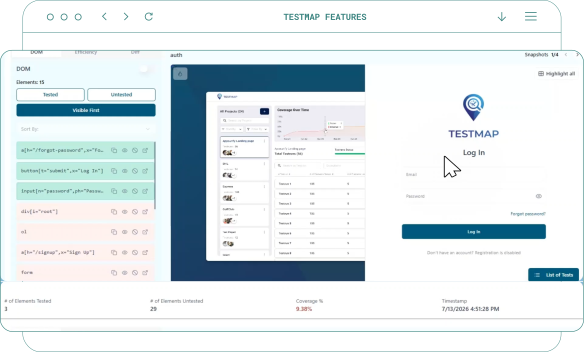

TestMap DOM coverage heatmap with tested elements in teal and untested elements outlined in red
TestMap dashboard with coverage trend bars across five runs and a Regression Detected alert for run 127 versus run 126 on /checkout
TEST RUN DIFFS

Catch the test that quietly stopped clicking.

A refactor renames a selector. A .only slips in. An AI-written test asserts on the wrong element. Line coverage barely moves. TestMap lists every element that lost coverage since the last run, with its traffic, so the checkout button stands out from a footer link.

BEHAVIORAL COVERAGE

Rank every gap by what users actually do.

Plain coverage treats every element as equal. TestMap weights each one by real Google Analytics 4 traffic and sorts your gaps into four buckets: Not Tested, Under Tested, Over-Tested, Optimized. A to-do list ordered by risk — and a Test Efficiency Score from 0 to 100 that leadership can track.
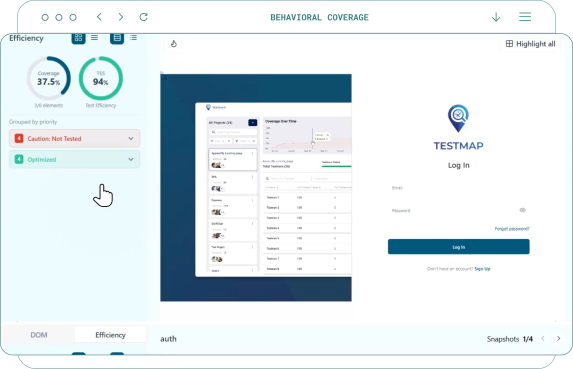

TestMap behavioral coverage view with a usage bar and a tests bar for each element
Fits your stack

Works with what you already have.

One import in your suite. One tag on your site. No new pipeline.
COMMON QUESTION

Why is code coverage misleading?

Code coverage measures execution, not verification. A line counts as covered the moment a test runs through it — asserted or not, used by real users or not. The number rises when you add tests anywhere and stays flat when a test stops clicking the one button that matters. That is how a suite reports 94% and still misses mobile checkout.

Can you have 100% code coverage and still have bugs?
Yes. Code coverage only records that a line executed during a test. It does not know whether the test asserted anything, whether the inputs matched what real users send, or whether the UI element that calls that line was ever clicked. Teams ship sev-1 incidents from branches with 90%+ coverage because the untested part was a user interaction, not a line of code.
What is the difference between code coverage and test coverage?
Code coverage is the percentage of source lines, branches or statements executed by tests; tools such as Istanbul and JaCoCo report it. Test coverage is broader: the share of requirements, scenarios or, in TestMap’s case, interactive UI elements that tests exercise. Code coverage tells you about your code. Test coverage tells you about your product.
What is a good test coverage percentage?
For code coverage, most teams settle around 70–80% of lines and see diminishing returns beyond that. For UI test coverage the useful target is a priority, not a percentage: every element with meaningful user traffic has at least one test, and elements no user touches are not absorbing dozens. TestMap expresses this as a Test Efficiency Score from 0 to 100.
What should I measure instead of code coverage?
Measure the elements users can touch and whether tests touch them (DOM Coverage), weight those elements by real traffic (Behavioral Coverage), and track the change between runs (Test Run Diffs). Together they answer the three questions code coverage cannot: what is protected, what matters most, and what just changed.

See your first heatmap in under 10 minutes.

Free tier. No instrumentation. The tests you already have.